Analysis of Real Estate Sectors
Fall Quarter 2024
This project analyzes nine major real estate sectors to assess their profitability and volatility, providing a clear risk-return comparison across sectors.
Project Information
Date Complete: Fall Quarter 2024
Overview: This project analyzes nine major real estate sectors to assess their profitability and volatility, providing a clear risk-return comparison across sectors.
Technologies and Key Processes
- Data Analysis Tools: Excel for financial modeling and sector comparison.
- Statistical Analysis: Applied standard deviation for volatility calculations and correlation matrix for sector relationships.
- Visualization: Used graphs and charts to present return profiles and sector volatility.
Outcome
- Apartments and healthcare sectors identified as stable choices for low-risk investors.
- Data centers and industrial real estate highlighted for high-growth potential.
- Lodging sector flagged as volatile and high-risk.
Grade: A
Project Description
This project, simply put, involved turning years of raw monthly real estate data into usable insights about the residential sector.
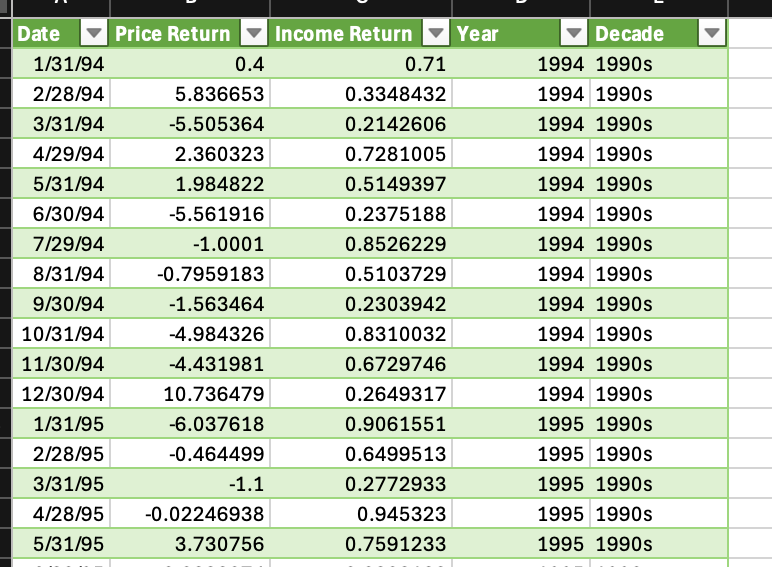
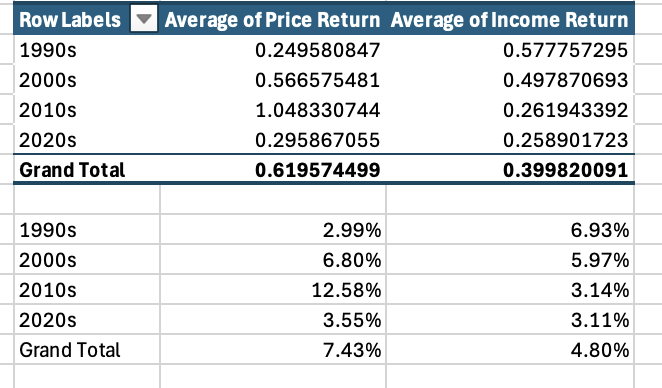
I started with nine Excel files, each representing a different real estate sector, and each containing three columns: date, price return, and income return. I added two more columns for better organization. After organizing the data, step two was to create average return by decade tables, which calculated the average price return and income return for each decade. Once this was done, I repeated the process to measure volatility in price and income returns by decade. After completing this for all nine sectors, I created three graphs to summarize these findings for each sector.
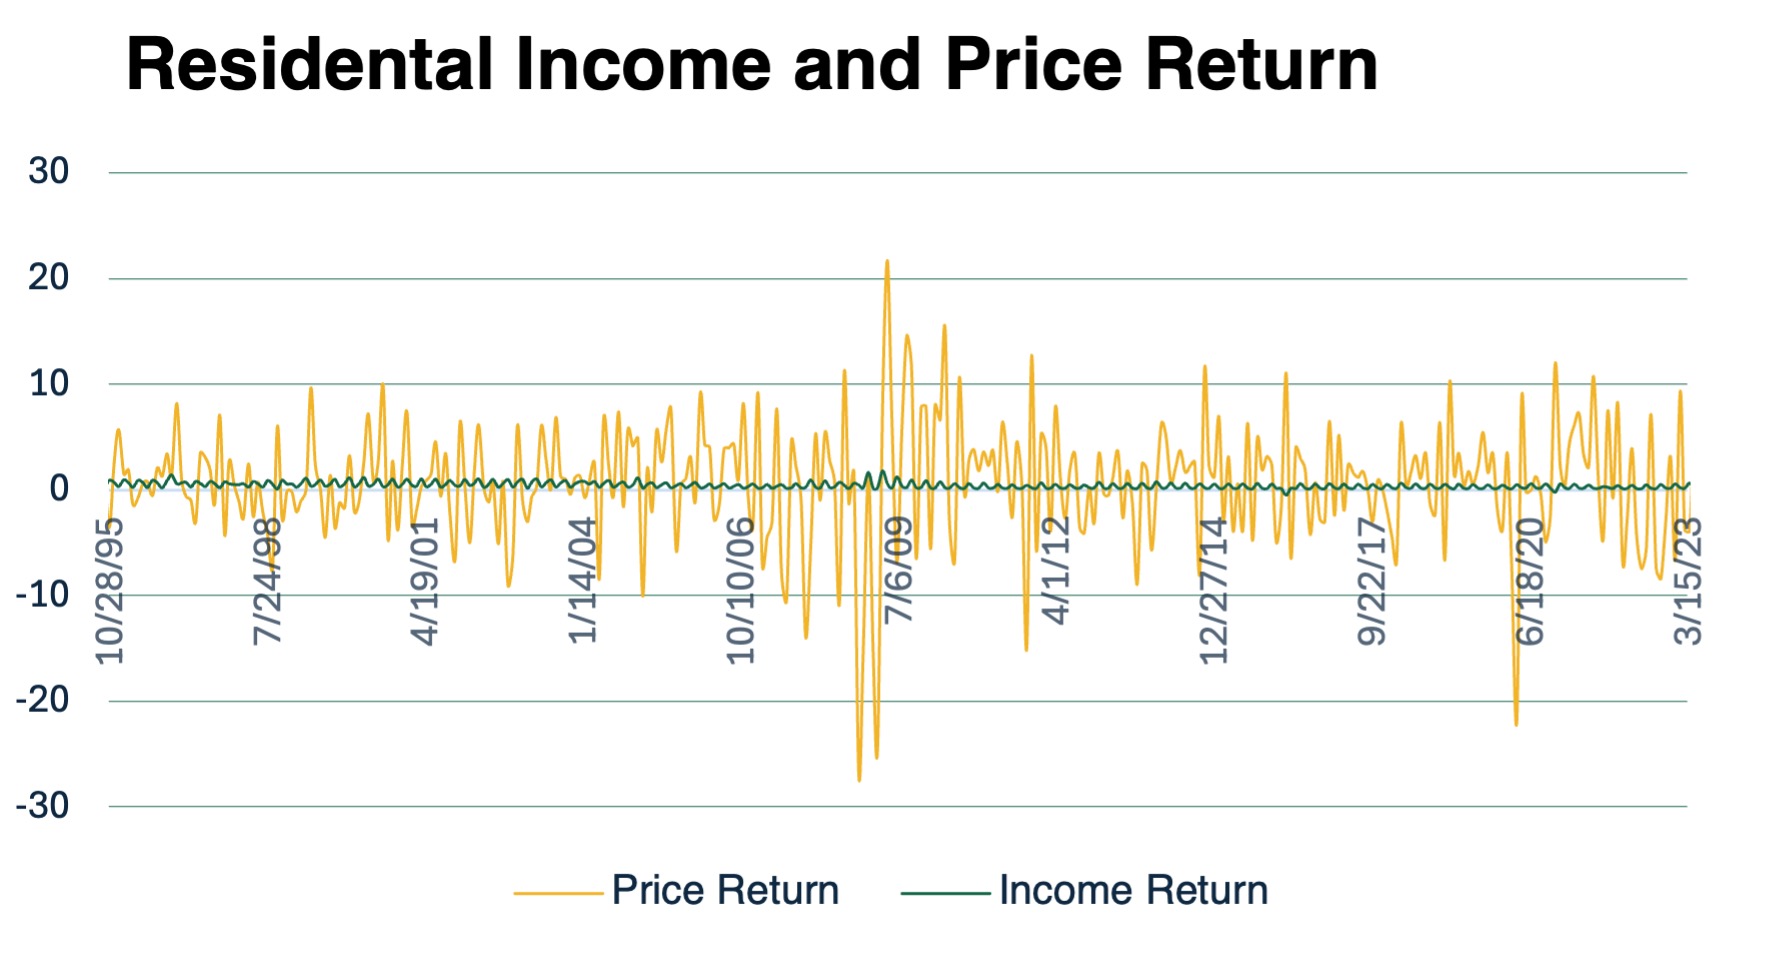
Graph of Income and Price Return: This type of graph compares trends in income and price returns, helping to visualize the relationship between stable income streams and more fluctuating price changes over time.
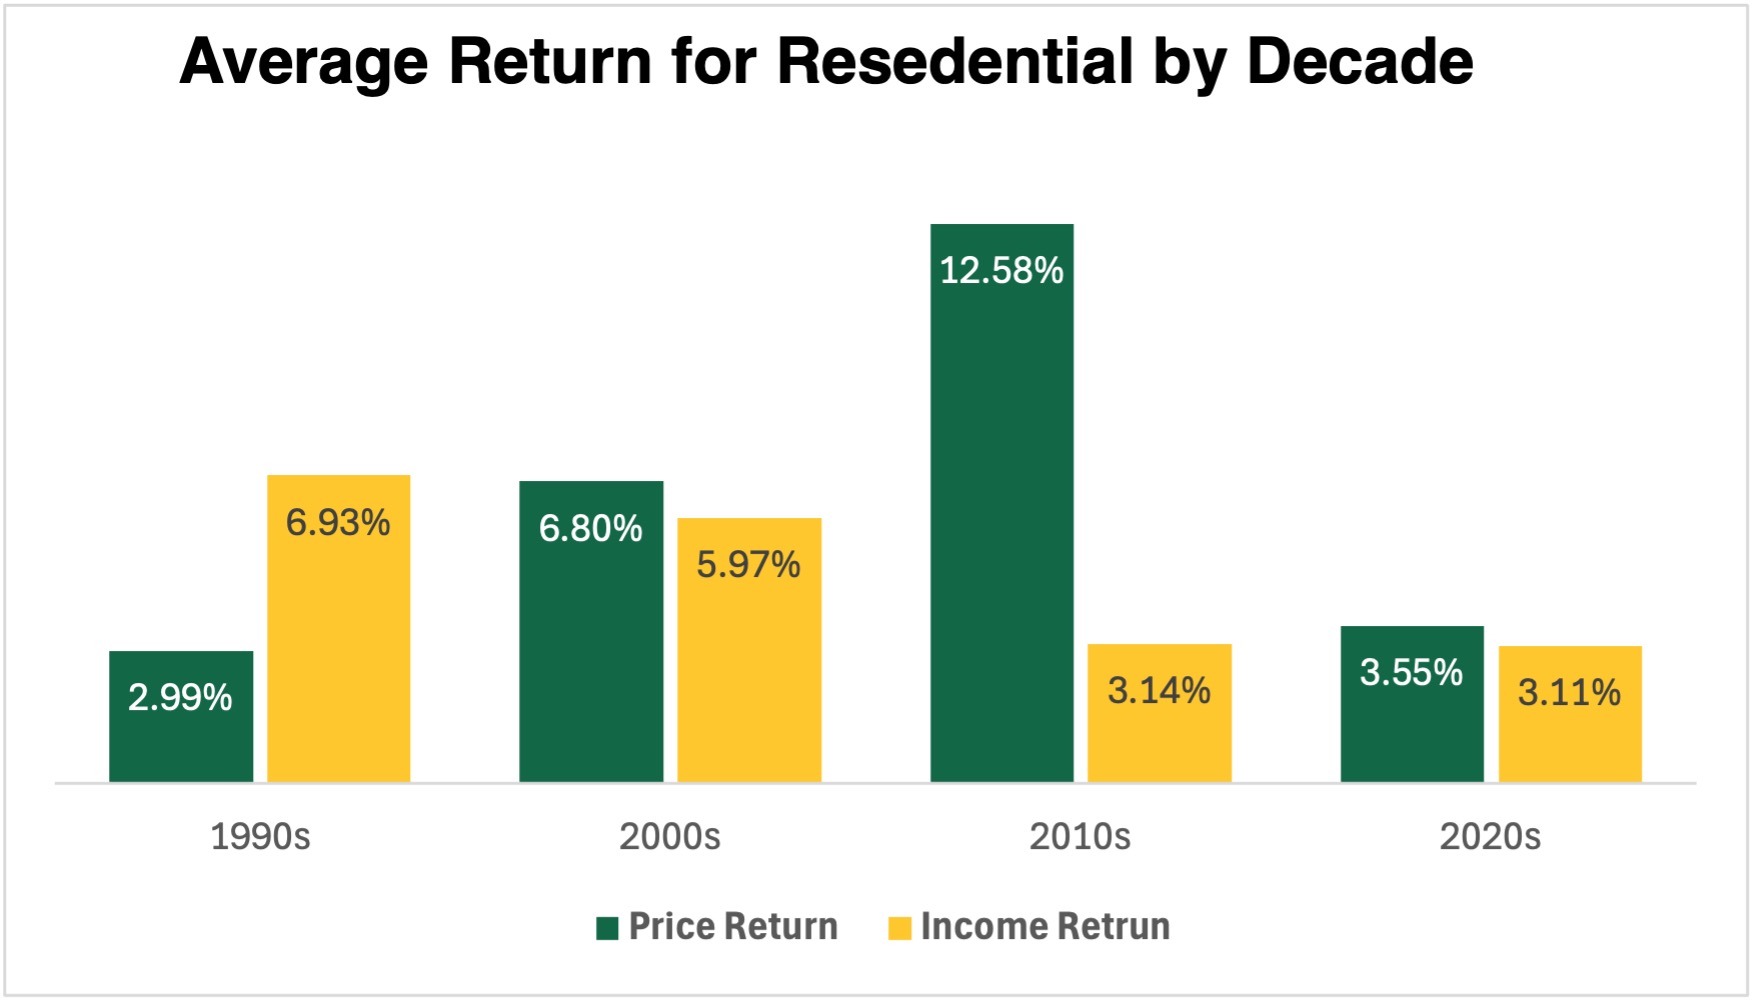
Returns by Decade: These graphs break down average returns by decade to show long-term trends and highlight how different time periods compare in terms of performance.
Income and Price Volatility: Volatility graphs provide insight into the stability of income and price returns by measuring how much they fluctuate over specific periods.
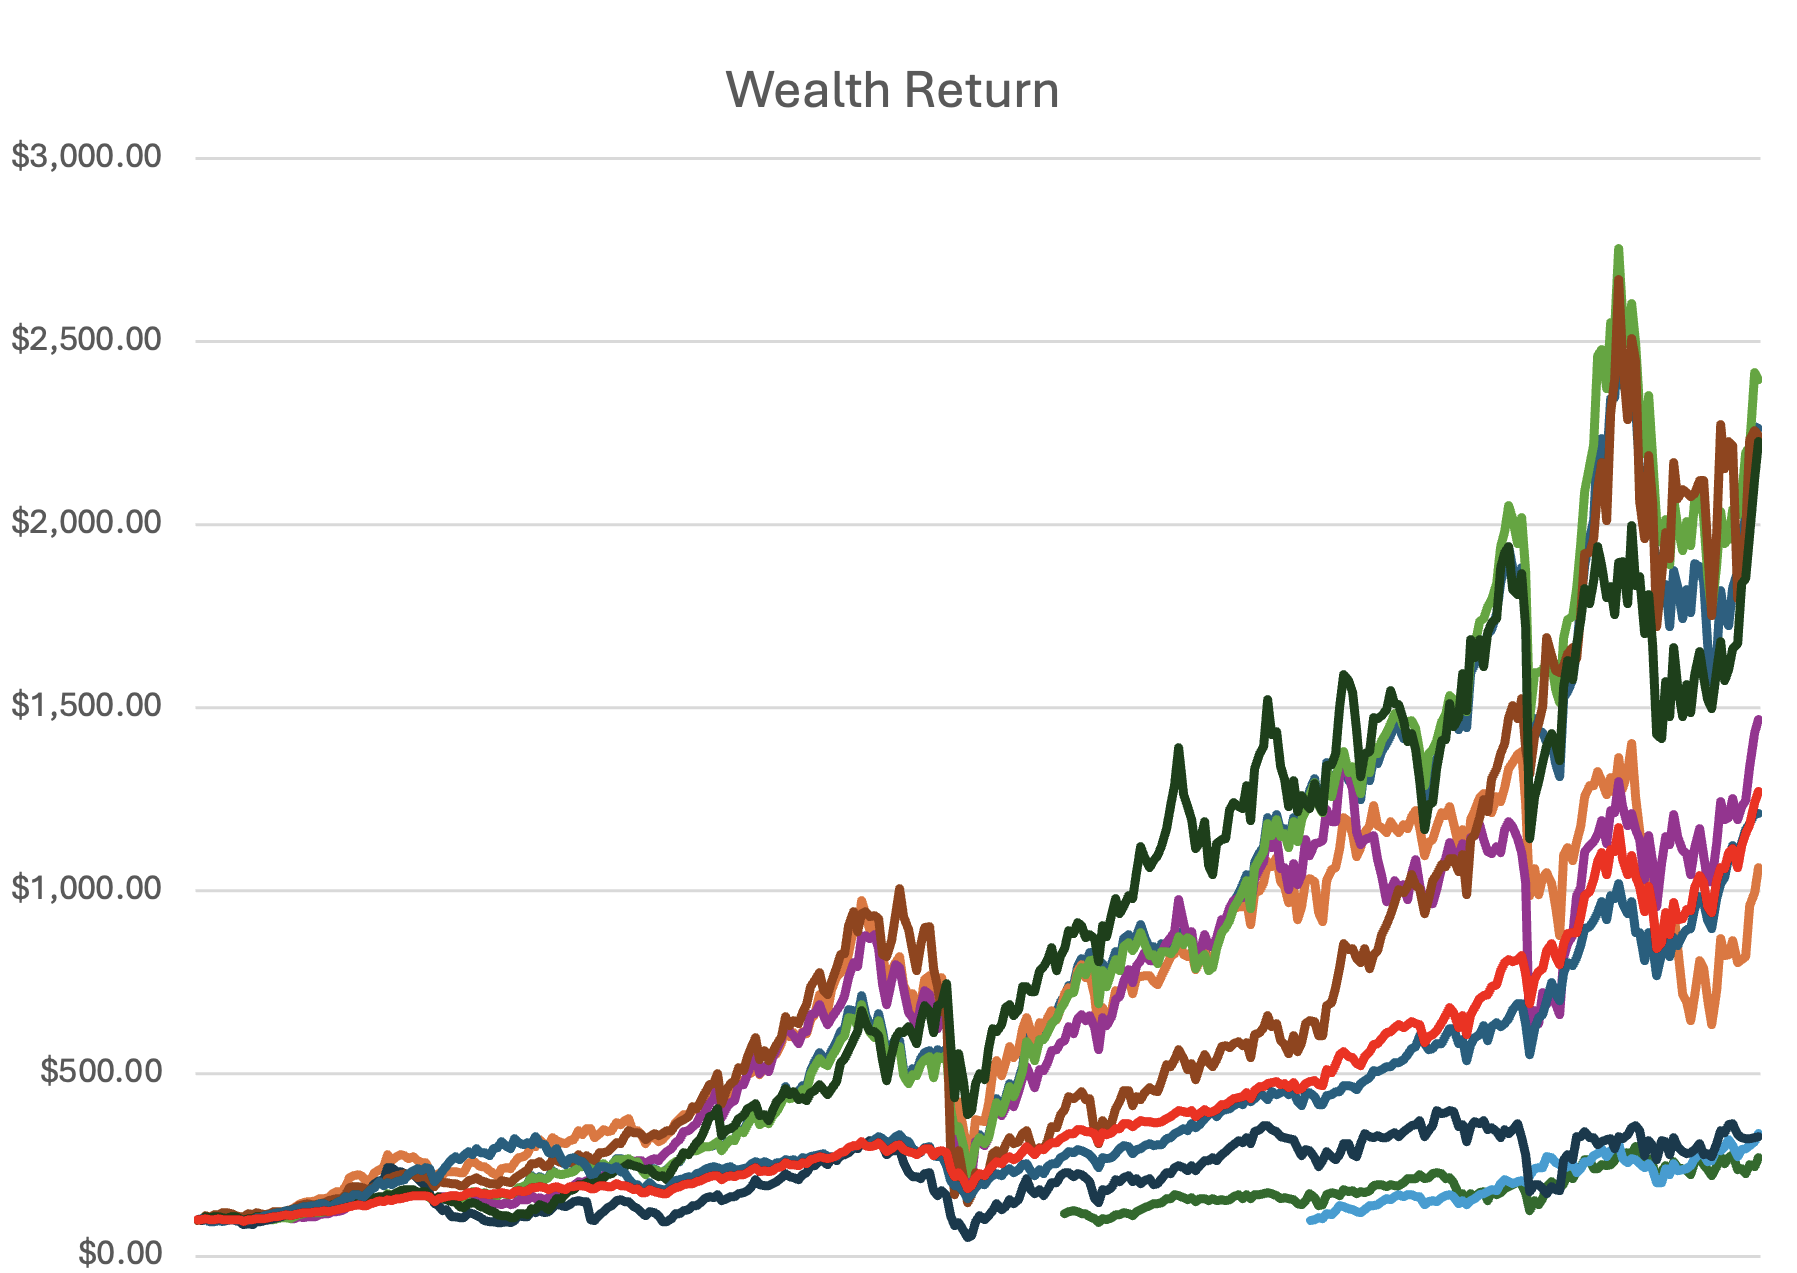
The final steps of this project were to build a correlation matrix between sectors and create a summary graph to identify which sectors stood out the most. These final analyses helped tie everything together by showing relationships between sectors and highlighting outliers.
Deliverable Link: Real Estate Sectors by Daniel Almond.pdf
Project Graphs and Visualizations